The vitreous gel normally displays a graded density at different anatomical locations. Although it is estimated to be nearly 90% water, the vitreous gel contains diverse proteins, proteoglycans, and small molecules that originate from within and outside the eye. In specific vitreoretinal diseases, the gel composition changes and some proteins may be differentially expressed. Understanding the molecular basis associated with clinical changes to the vitreous gel may help determine some of the underlying mechanisms of vitreoretinal diseases.
Vitreous biopsies are frequently utilized in the clinical diagnosis and management of intravitreal infection, inflammation, and cancer. Vitreous biopsies are routinely obtained by one of two different methods. In the most common and least invasive method, a needle is inserted through the pars plana into the vitreous cavity, and fluid is manually aspirated into a syringe. Since the instrumentation is simple and the procedure straightforward, needle biopsies may be performed under topical anesthesia in an outpatient clinic setting. The second technique is more complex, invasive, and is performed under regional and/or systemic anesthesia in an operating room. This method utilizes a vitreous cutter that requires a high-speed guillotine blade that can “chop” the vitreous gel and aspirate fluid.
The purpose of this pilot study was to determine differences in proteins extracted by the needle and vitreous cutter biopsy techniques. We found that proteins and peptides collected from vitreous needle biopsies are nearly equivalent to those obtained from a vitreous cutter instrument. This study suggests both techniques may be used for most proteomic and biomarker discovery studies of vitreoretinal diseases, although a minority of proteins and peptides may differ in concentration.
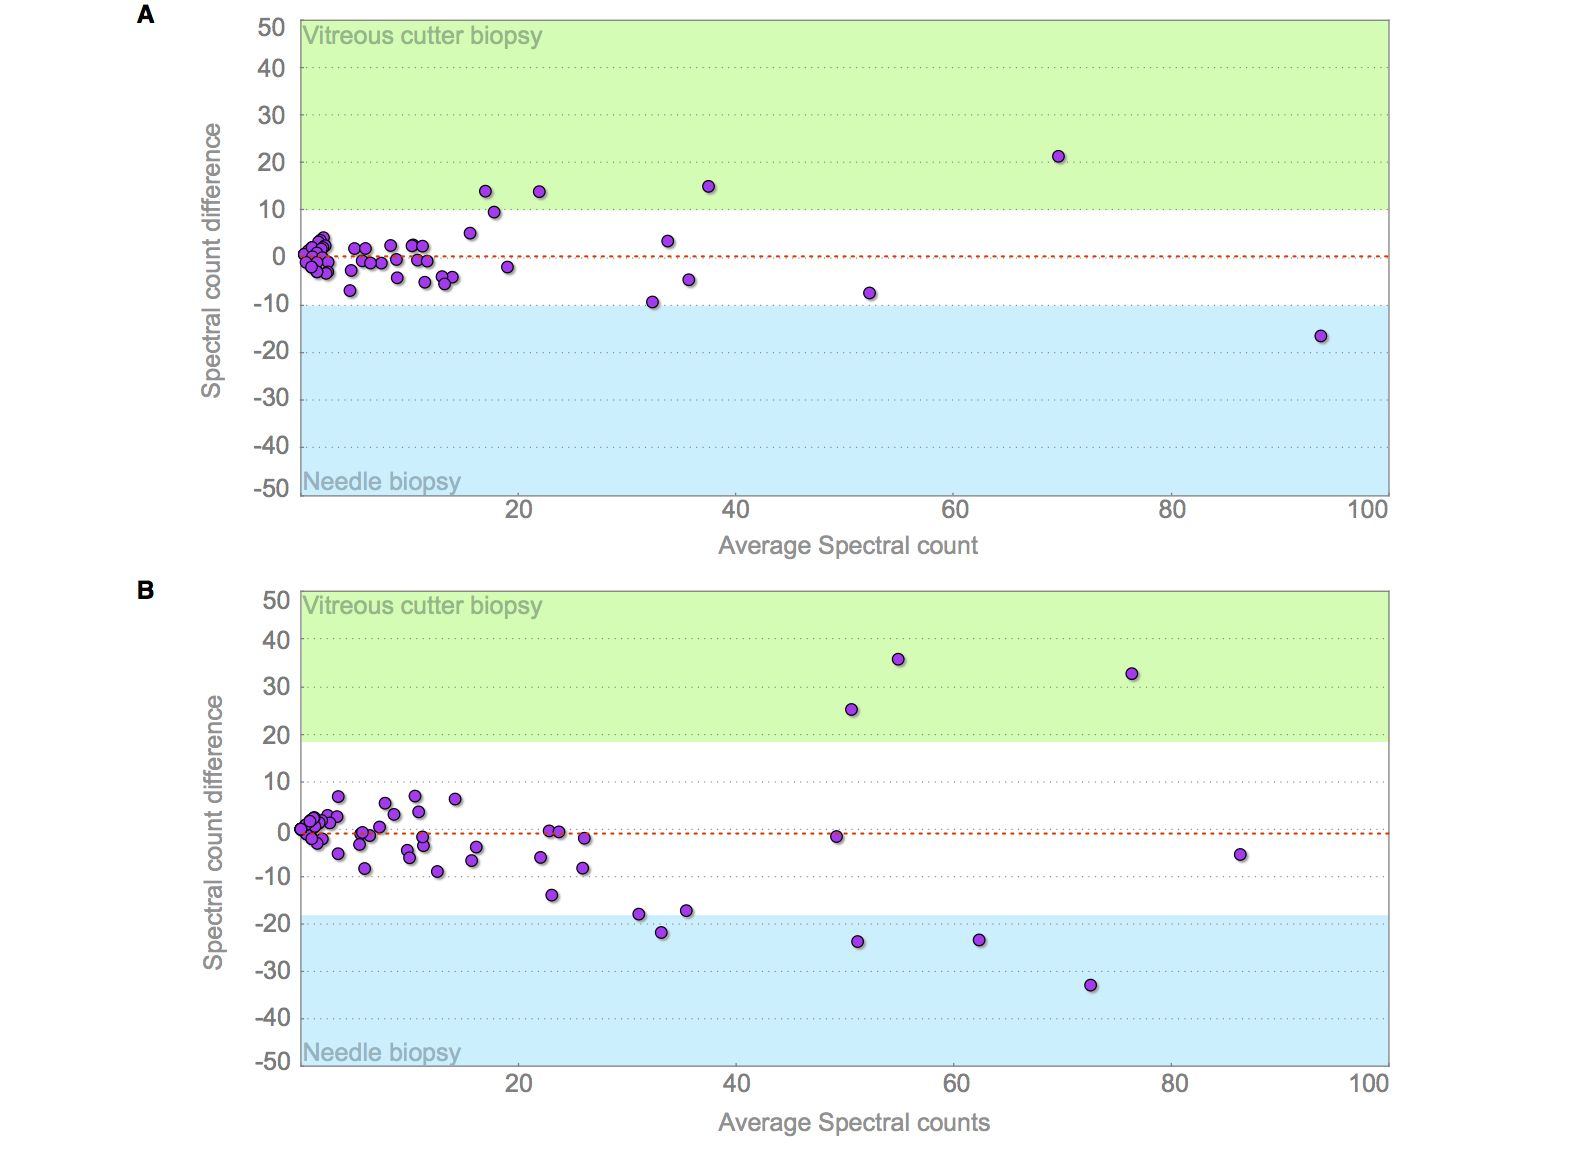
In the image below, peptide spectral counts shows a high correlation between vitreous cutter and needle biopsy profiles on a Bland-Altman plot of LC-MS/MS data. A. Sample-1. Idiopathic uveitis. B. Sample-2. Proliferative diabetic retinopathy. The Bland-Altman plot shows the average spectral count values between the vitreous cutter and needle biopsies ((vitreous cutter + needle)/2); x-axis) graphed against the difference in spectral counts between the two techniques (vitreous cutter – needle; y-axis). Red, dotted line: average difference; gray region: 95% limits of agreement (±1.96 SD); green region: outlier with greater detection in the vitreous cutter instrument biopsy; blue region: outlier with greater detection in the needle biopsy.